这一篇在干嘛?
这一篇讲两件互补的事:先看「数据」——用 Memory 窗口查看设计里每一块存储器的内容,把内存数据导出成文件、再反过来用文件或填充模式初始化内存,这对验证 RAM 模块非常有用;再看「时间」——用 Profiler 统计每段代码、每个实例吃掉多少仿真时间和内存,找出瓶颈后针对性地优化。示例设计是一个控制行为级存储器的有限状态机及其 test bench。
内存查看与初始化(原文第 11 章)
Questa SIM 把以下类型定义为「memory」:reg、wire 和 std_logic 数组;Integer 数组;以及 VHDL 枚举类型(std_logic 除外)的一维数组。
编译并加载设计
示例文件路径:
- Verilog –
<install_dir>/examples/tutorials/verilog/memory - VHDL –
<install_dir>/examples/tutorials/vhdl/memory
本课以 Verilog 版本为例,有 VHDL license 的读者可改用 VHDL 版本。
- 新建目录,把
<install_dir>/examples/tutorials/verilog/memory下所有文件复制进去(VHDL 用户复制vhdl/memory目录)。 - 启动 Questa SIM 并切换目录:
- UNIX shell 输入
vsim,或 Windows 下点 Questa SIM 图标;欢迎对话框出现则点 Close。 - 选 File > Change Directory 切到练习目录。
- UNIX shell 输入
- 创建工作库并编译设计:
- 在 Questa SIM> 提示符输入
vlib work。 - Verilog:输入
vlog *.v编译所有 Verilog 文件。 - VHDL:输入
vcom -93 sp_syn_ram.vhd dp_syn_ram.vhd ram_tb.vhd。
- 在 Questa SIM> 提示符输入
- 优化设计:在 Questa SIM> 提示符输入:
vopt +acc ram_tb -o ram_tb_opt+acc 开关为调试保留设计可见性;-o 开关指定优化后设计文件的名字(ram_tb_opt)。
注意
使用 vopt 命令时必须为优化后的设计文件指定名字。
- 加载设计:
- 在主窗口 Workspace 的 Library 标签页,点 work 库旁的「+」图标展开。
- 用优化后的设计名加载:
vsim ram_tb_opt。
查看存储器及其内容
Memory List 窗口列出设计中所有存储器实例,显示每个实例的 Range(范围)、Depth(深度)和 Width(位宽)。双击某个实例会打开一个显示该存储器数据的窗口。
- 打开 Memory List 窗口并查看存储器数据:
- 若 Memory List 窗口未打开,选 View > Memory List。
Memory List 窗口内容如下(Figure 11-1):
| Instance | Range | Depth | Width |
|---|---|---|---|
| /ram_tb/spram1/mem | [0:4095] | 4096 | 8 |
| /ram_tb/spram2/mem | [0:2047] | 2048 | 17 |
| /ram_tb/spram3/mem | [0:65535] | 65536 | 32 |
| /ram_tb/spram4/mem | [0:3] | 4 | - |
| /ram_tb/dpram1/mem | [0:15] | 16 | 8 |
- 在列表中双击 /ram_tb/spram1/mem 实例查看其内容。
一个 Memory Data 窗口打开,显示 spram1 的内容:第一列(蓝色十六进制字符)是地址,其余列是数据值。若用 Verilog 示例设计,此时数据全是 X(Figure 11-2),因为还没跑仿真。
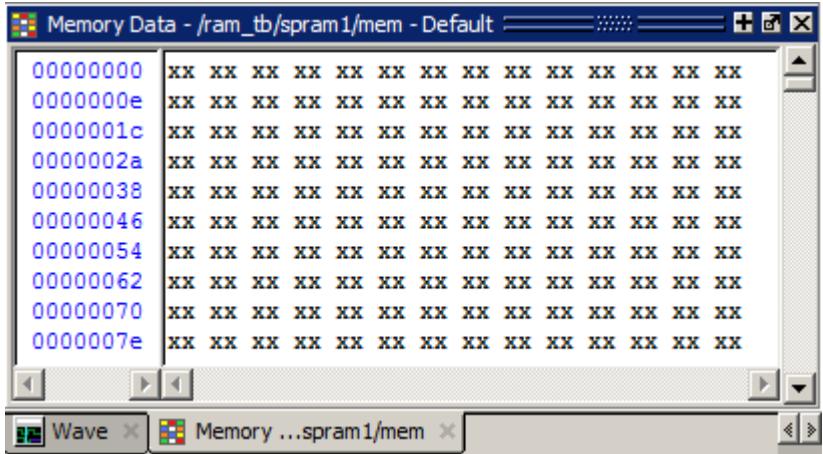
若用 VHDL 示例设计,数据全是 0(Figure 11-3):
| 00000000 | 00 00 00 00 00 00 00 00 00 00 00 00 00 00 00 |
|---|---|
| 00000010 | 00 00 00 00 00 00 00 00 00 00 00 00 00 00 00 |
| 00000020 | 00 00 00 00 00 00 00 00 00 00 00 00 00 00 00 |
| 00000030 | 00 00 00 00 00 00 00 00 00 00 00 00 00 00 00 |
| 00000040 | 00 00 00 00 00 00 00 00 00 00 00 00 00 00 00 |
| 00000050 | 00 00 00 00 00 00 00 00 00 00 00 00 00 00 00 |
| 00000060 | 00 00 00 00 00 00 00 00 00 00 00 00 00 00 00 |
| 00000070 | 00 00 00 00 00 00 00 00 00 00 00 00 00 00 |
- 再双击 /ram_tb/spram2/mem 实例,会打开第二个 Memory Data 窗口。每点一个实例都会新开一个窗口。
-
运行仿真:
- 点击主窗口的 Run -All 图标。
Source 窗口打开,显示仿真停止处 ram_tb 文件的源代码。VHDL 用户会看到可忽略的 NUMERIC_STD 警告和一个用来停止仿真的 assertion failure——仿真本身并没有失败。
- 点击 Memory …spram1/mem 标签把该窗口带到前台。Verilog 数据如 Figure 11-4 所示。
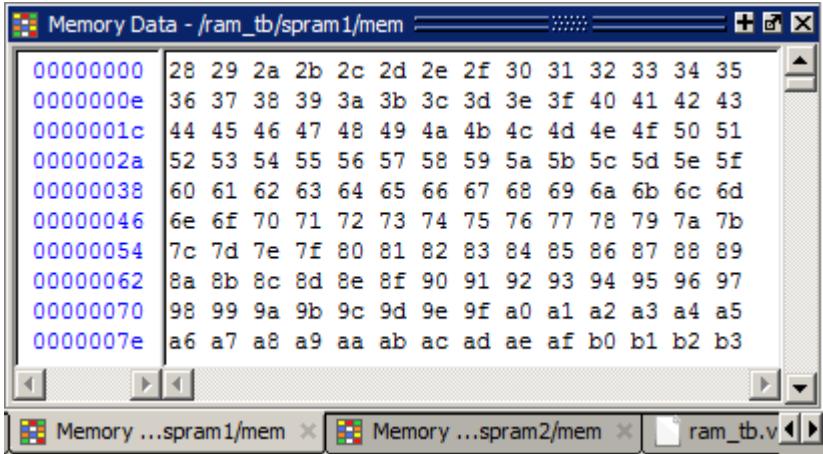
VHDL 数据如 Figure 11-5 所示:
| 00000000 | 40 | 41 | 42 | 43 | 44 | 45 | 46 | 47 |
|---|---|---|---|---|---|---|---|---|
| 00000008 | 48 | 49 | 50 | 51 | 52 | 53 | 54 | 55 |
| 00000010 | 56 | 57 | 58 | 59 | 60 | 61 | 62 | 63 |
| 00000018 | 64 | 65 | 66 | 67 | 68 | 69 | 70 | 71 |
| 00000020 | 72 | 73 | 74 | 75 | 76 | 77 | 78 | 79 |
| 00000028 | 80 | 81 | 82 | 83 | 84 | 85 | 86 | 87 |
| 00000030 | 88 | 89 | 90 | 91 | 92 | 93 | 94 | 95 |
| 00000038 | 96 | 97 | 98 | 99 | 100 | 101 | 102 | 103 |
- 修改 /ram_tb/spram1/mem 的地址基和每行字数:
- 右键该 Memory Data 窗口内容,选 Properties,打开 Properties 对话框(Figure 11-6)。
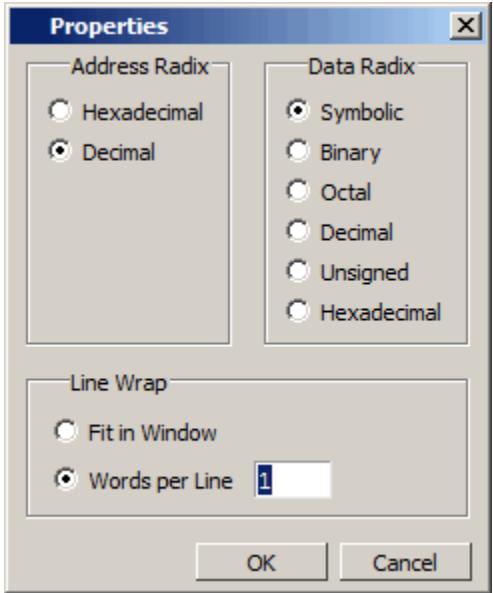
- Address Radix 选 Decimal(只改地址的基)。
- Data Radix 改为 Symbolic。
- 选 Words per line,在输入框填 1。
- 点 OK。
Verilog 的效果见 Figure 11-7,VHDL 的效果见 Figure 11-8。如果画面对不上,检查是否误把 Address Radix 设成了 Data Radix——Data Radix 应保持默认的 Symbolic。
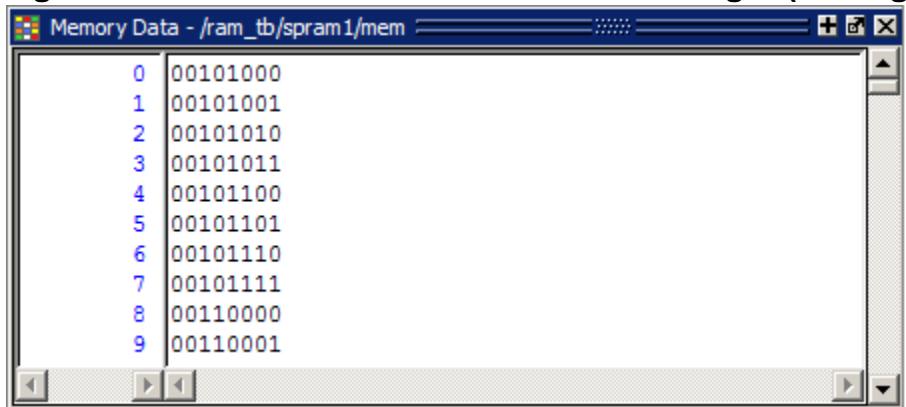
新的地址基与行长度(VHDL):
| 0 | 40 |
|---|---|
| 1 | 41 |
| 2 | 42 |
| 3 | 43 |
| 4 | 44 |
| 5 | 45 |
| 6 | 46 |
| 7 | 47 |
在存储器内导航
可以跳转到指定地址,也可以搜索特定数据模式。先跳转到指定地址:
- 用 Goto 找指定地址:
- 在地址列任意处右键,选 Goto,数据窗格中弹出 Goto 对话框(Figure 11-9)。
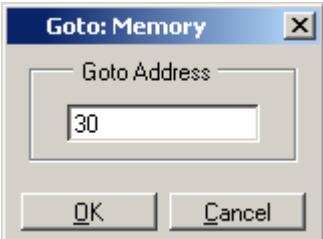
- 在 Goto Address 栏输入 30,点 OK。目标地址出现在窗口顶行。
- 直接编辑地址栏快速跳转:
- 在地址列双击地址 38。
- 输入地址 100(Figure 11-10)。
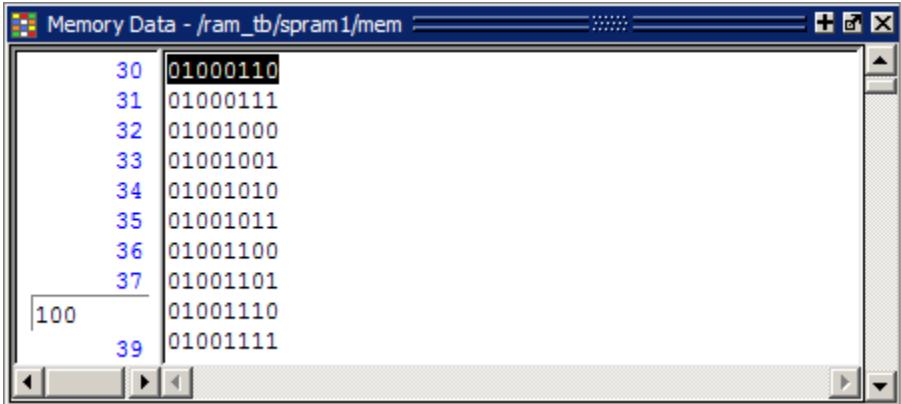
- 按回车键,窗格跳到地址 100。
- 查找特定数据:
- 在数据列任意处右键,选 Find,打开 Find in 对话框(Figure 11-11)。
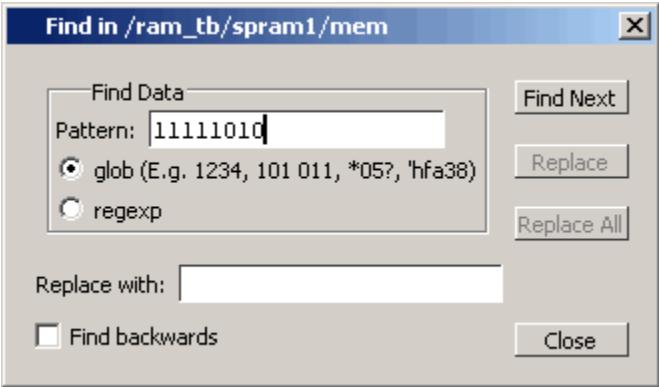
- Verilog:在 Find Data 栏输入 11111010,点 Find Next。
- VHDL:在 Find Data 栏输入 250,点 Find Next。
数据滚动到第一个匹配处;多点几次 Find Next 可继续向下搜索。
- 点 Close 关闭对话框。
导出内存数据到文件
可以把内存数据存成文件,供仿真后期重新加载。
- 从 /ram_tb/spram1/mem 实例导出一份内存模式:
- 确认 /ram_tb/spram1/mem 窗口已打开并选中。
- 选 File > Export > Memory Data,打开 Export Memory 对话框(Figure 11-12)。
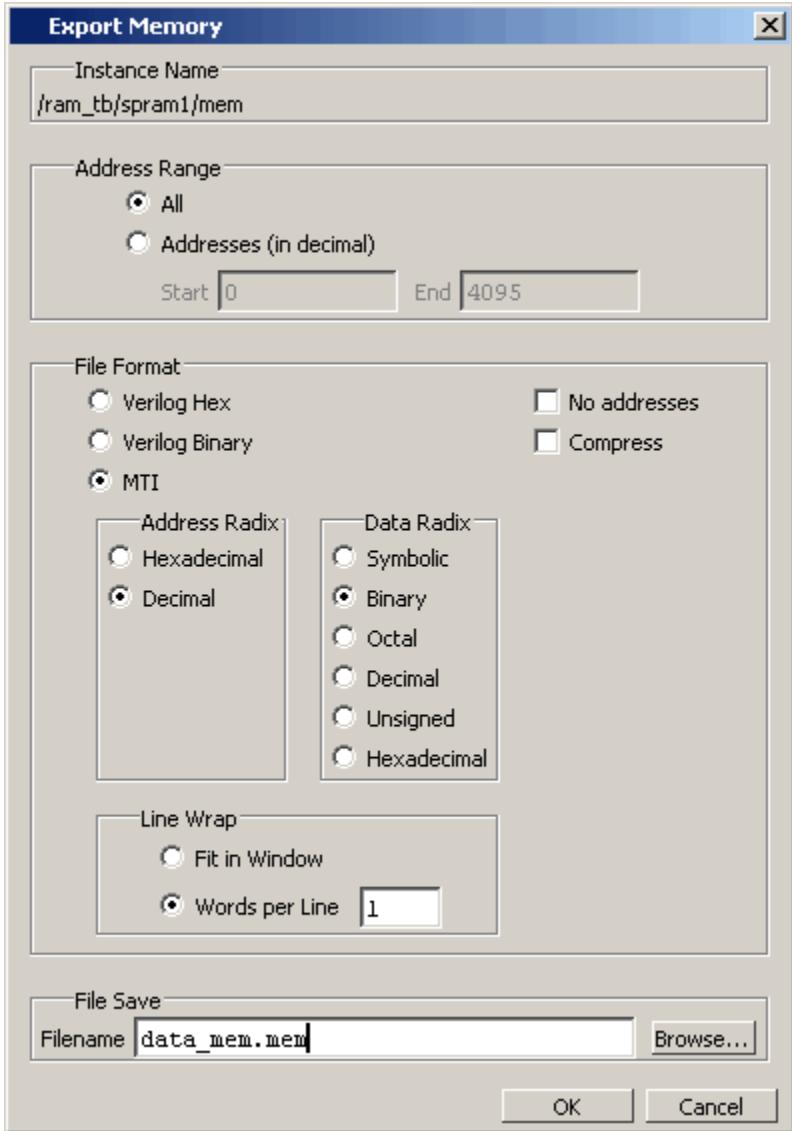
- Address Radix 选 Decimal。
- Data Radix 选 Binary。
- Words per Line 设为 1。
- 在 Filename 栏输入 data_mem.mem。
- 点 OK。导出的文件可用任意编辑器查看。
内存模式文件还可以导出为「可重定位」文件——只要不带地址信息即可。因为不含地址,可重定位文件可以加载到内存的任意位置。
- 从 /ram_tb/spram2/mem 实例导出可重定位内存模式文件:
- 选中 /ram_tb/spram2/mem 的 Memory Data 窗口。
- 右键内存内容打开弹出菜单,选 Properties。
- 在 Properties 对话框中:Address Radix 设为 Decimal,Data Radix 设为 Binary,Line Wrap 设为 1 Words per Line,点 OK 保存并关闭。
- 选 File > Export > Memory Data 打开 Export Memory 对话框。
- Address Range 指定 Start 地址 0、End 地址 250。
- File Format 选 MTI 和 No addresses,生成可重定位到本内存其他位置或其他内存的内存模式。
- Address Radix 选 Decimal,Data Radix 选 Binary。
- Words per Line 设为 1。
- 文件名输入 reloc.mem,点 OK 保存并关闭。下一节初始化时会用到这个文件。
初始化存储器
Questa SIM 支持三种内存初始化方式:从导出的内存文件、从填充模式(fill pattern)、或两者结合。先只用文件初始化——用刚导出的 data_mem.mem。
- 查看 /ram_tb/spram3/mem 实例:
- 在 Memory List 窗口双击 /ram_tb/spram3/mem,新开的 Memory Data 窗口显示其内容。先熟悉一下内容,便于初始化完成后对比变化。
- 右键选 Properties 打开 Properties 对话框。
- 把 Address Radix 改为 Decimal、Data Radix 改为 Binary、Words per Line 改为 1,点 OK。
- 从文件初始化 spram3:
- 在数据列任意处右键,选 Import Data Patterns,打开 Import Memory 对话框(Figure 11-13)。
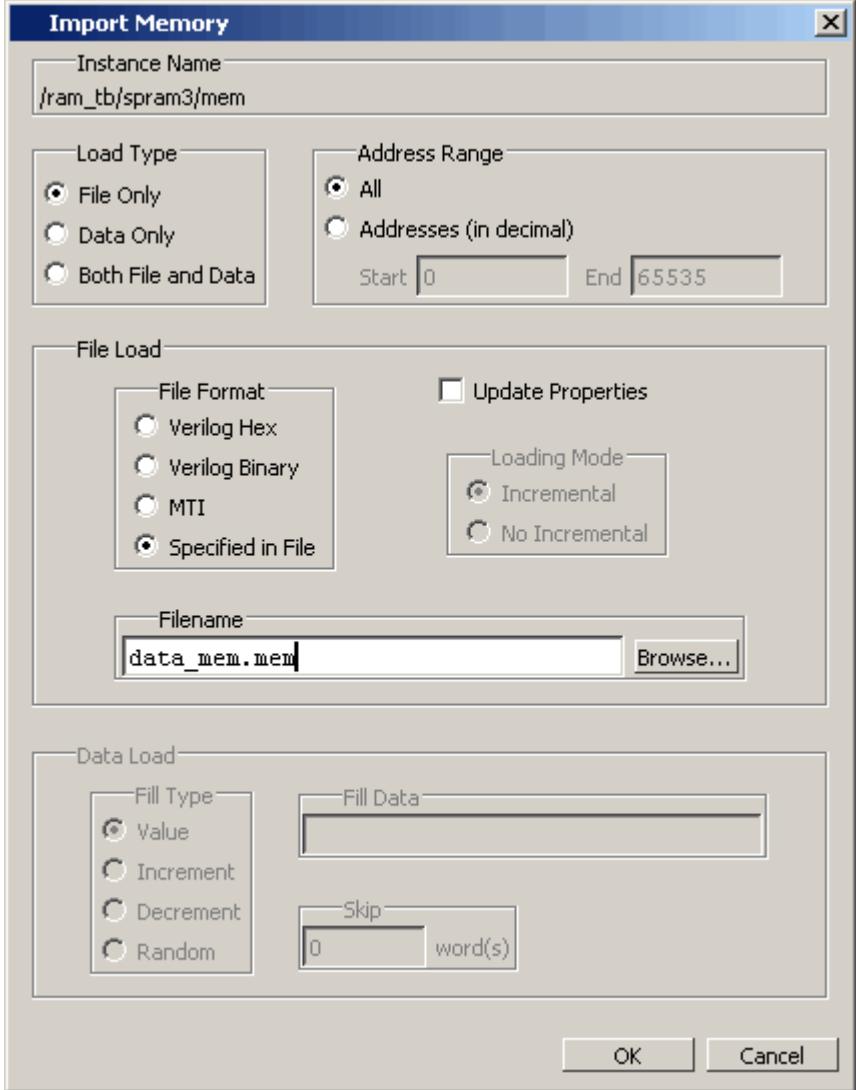
默认 Load Type 是 File Only。
- Filename 栏输入 data_mem.mem。
- 点 OK。
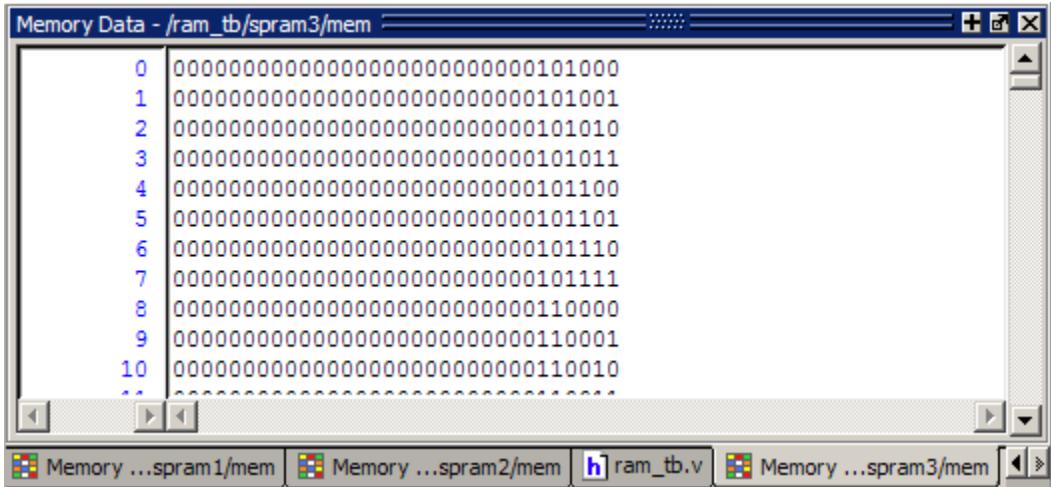
/ram_tb/spram3/mem 的地址被 data_mem.mem 中的数据更新(Figure 11-14)。
下一步体验「文件 + 填充模式」同时导入:用之前导出的可重定位文件 reloc.mem(251 个地址的数据)初始化 spram3,另外再用填充模式初始化 50 个额外地址。
-
用可重定位模式(reloc.mem)加填充模式导入 /ram_tb/spram3/mem:
- 在 spram3 数据列右键,选 Import Data Patterns 打开 Import Memory 对话框。
- Load Type 选 Both File and Data。
- Address Range 选 Addresses,Start 地址填 0、End 地址填 300。
即从 0 到 300 加载文件;但 reloc.mem 只有 251 个地址的数据,251 到 300 的地址将用接下来指定的填充数据加载。
- File Load 选 MTI 文件格式,Filename 栏输入 reloc.mem。
- Data Load 的 Fill Type 选 Increment。
- Fill Data 栏填种子值 0,作为递增数据的起点。
- 点 OK。
- 双击地址列任意地址、输入 250,查看地址 250 附近的数据。
可见指定范围的地址已被新数据覆盖,且从地址 251 开始出现递增数据(Figure 11-15):
| 250 | 00000000000000000010010000100010 |
|---|---|
| 251 | 00000000000000000000000000000000000000000000000000000000000000000000000000000000000000000000000000001 |
| 252 | 0000000000000000000000000000000000000000000000000000000000000000000000000000000000000000000000000010 |
| 253 | 00000000000000000000000000000000000000000000000000000000000000000000000000000000000000000000000000 |
| 254 | 000000000000000000000000000000000000000000000000000000000000000000000011 |
| 255 | 000000000000000000000000000000000000000000000000000000000000100 |
| 256 | 000000000000000000000000000000000000000000000000000000101 |
| 257 | 0000000000000000000000000000000000000000000000000110 |
| 258 | 00000000000000000000000000000000000000000000000111 |
离开本节前,把已打开的内存窗口清掉:在任一 Memory Data 窗口右键,选 Close All。
交互式调试命令
Memory Data 窗口还可以交互式地用于多种调试目的。
- 打开一个内存实例并修改显示特性:
- 在 Memory List 窗口双击 /ram_tb/dpram1/mem 实例。
- 在 dpram1 的 Memory Data 窗口右键,选 Properties。
- Address 和 Data Radix 都改为 Hexadecimal。
- 选 Words per line,输入 2。
- 点 OK,结果如 Figure 11-16 所示。
原始内存内容:
| 00000000 | 06 03 |
|---|---|
| 00000002 | 7a 1b |
| 00000004 | 1c 1d |
| 00000006 | 1e 1f |
| 00000008 | 20 21 |
| 0000000a | 22 23 |
| 0000000c | 24 25 |
| 0000000e | 26 27 |
- 用填充模式初始化一段地址范围:
- 在 /ram_tb/dpram1/mem 数据列右键,选 Change,打开 Change Memory 对话框(Figure 11-17)。
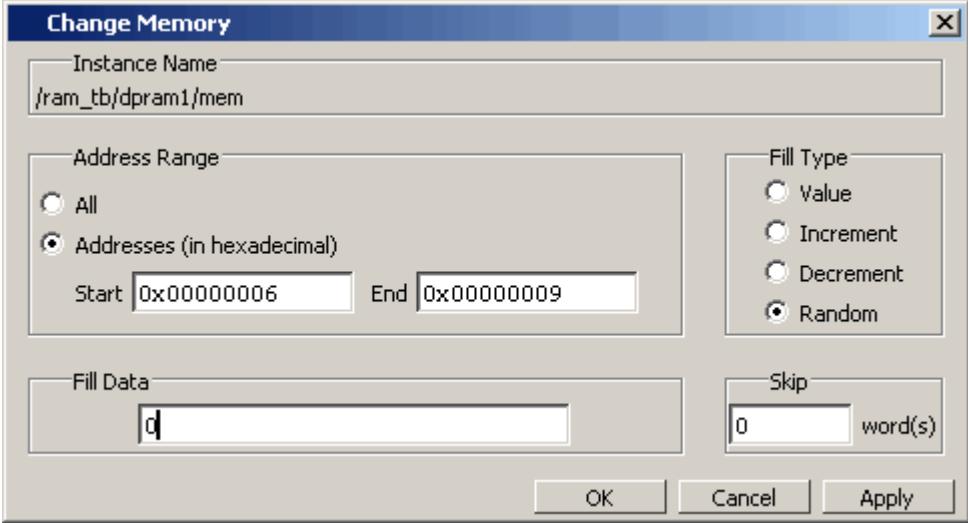
- 选 Addresses,起始地址填 0x00000006、结束地址填 0x00000009(「0x」十六进制前缀可省略)。
- Fill Type 选 Random。
- Fill Data 填 0,作为 Random 模式的随机种子。
- 点 OK。
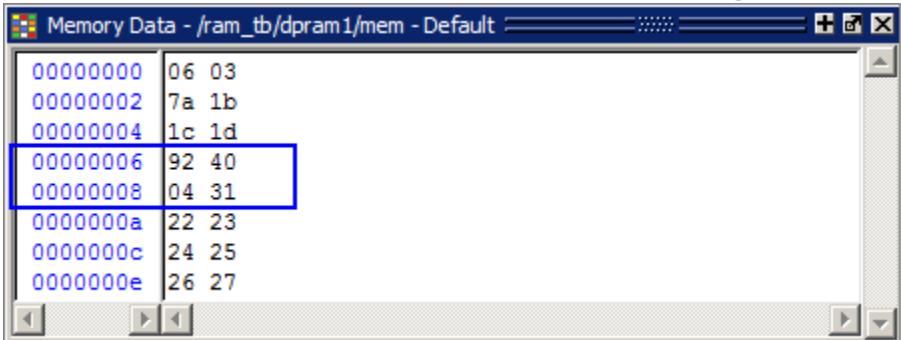
指定范围内的数据被生成的随机填充模式替换(Figure 11-18)。
- 用高亮选中直接改内容:也可以在 Address Data 窗格中高亮数据后修改。
- 高亮地址 0x0000000c:0x0000000e 的数据,如 Figure 11-19 所示。
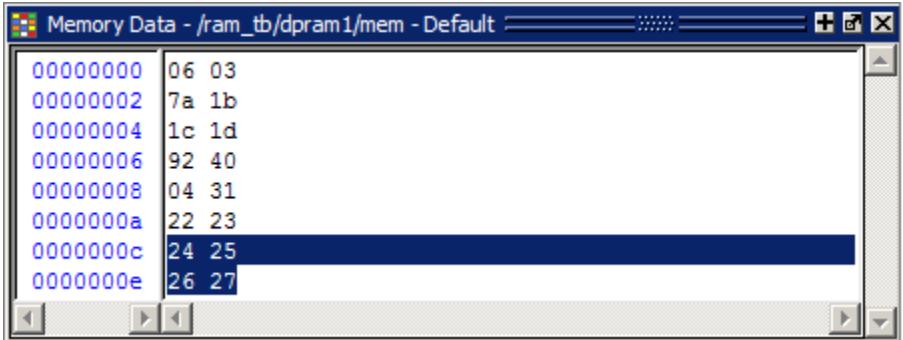
- 右键高亮数据选 Change,打开 Change Memory 对话框——Addresses 栏已自动填入你高亮的范围。
- Fill Type 选 Value(见 Figure 11-20)。
- 在 Fill Data 栏输入数据值:31 32 33 34。
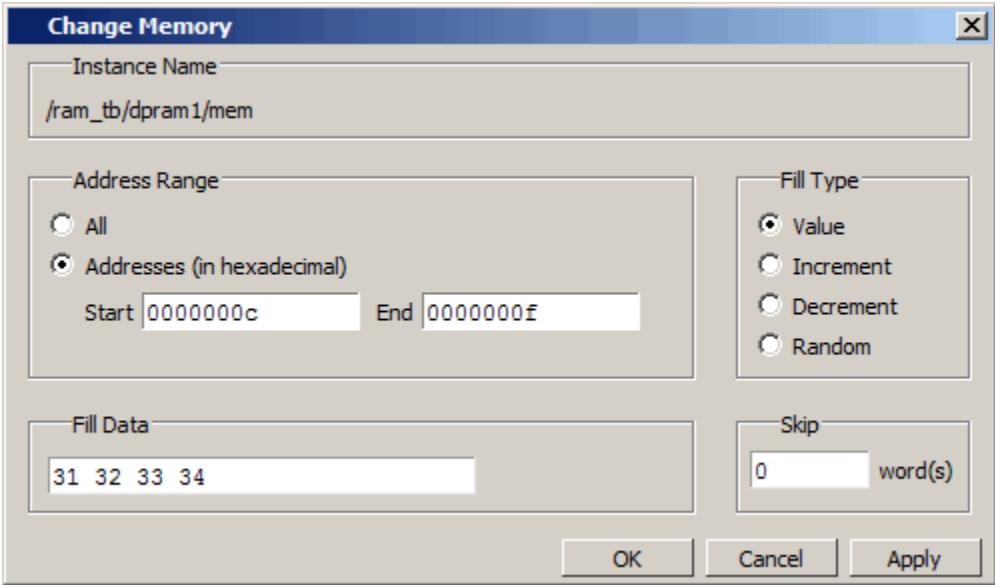
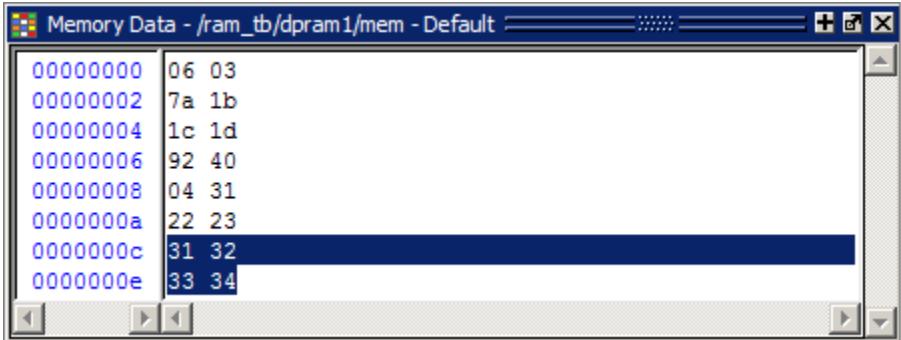
- 点 OK,指定地址的数据变成输入的值(Figure 11-21)。
- 原地编辑单个数据:一次只改一个值时:
- 双击 Data 列任意值。
- 输入新值后按回车;要取消编辑按 Esc 键。
本课收尾
- 选 Simulate > End Simulation,点 Yes。
用 Profiler 分析性能(原文第 12 章)
Profiler 统计仿真时间在各段代码中的占比,以及每个函数和实例分配到的内存量。据此可以定位瓶颈、优化代码、缩短仿真时间——有用户报告优化后仿真时间最多缩短了 75%。
前提条件
本章功能需要 Questa SIM license 文件中包含 profile license feature;没有的话请联系 Mentor Graphics 销售代表。另外,Profiler 必须在运行仿真之前启用(Tools > Profile > Performance),仿真跑完再开就来不及采样了。
编译并加载设计
本课示例设计是一个控制行为级存储器的有限状态机,test bench 为 test_sm。文件路径:
- Verilog –
<install_dir>/examples/tutorials/verilog/profiler - VHDL –
<install_dir>/examples/tutorials/vhdl/profiler_sm_seq
- 新建目录,把
<install_dir>/examples/tutorials/verilog/profiler下所有文件复制进去(VHDL 用户复制vhdl/profiler_sm_seq目录)。 - 启动 Questa SIM 并切换目录:
- UNIX shell 输入
vsim,或 Windows 下点 Questa SIM 图标;欢迎对话框出现则点 Close。 - 选 File > Change Directory 切到练习目录。
- UNIX shell 输入
- 创建工作库:在 Questa SIM> 提示符输入
vlib work。 - 编译设计文件:
- Verilog:输入
vlog *.v。 - VHDL:输入
vcom -93 sm.vhd sm_seq.vhd sm_sram.vhd test_sm.vhd。
- Verilog:输入
- 优化设计:在 Transcript 窗口的 Questa SIM> 提示符输入:
vopt +acc test_sm -o test_sm_opt+acc 开关为调试保留设计可见性;-o 开关指定优化后设计文件的名字(test_sm_opt)。使用 vopt 命令时必须为优化后的设计文件指定名字。
6. 加载优化后的设计单元:在 Questa SIM> 提示符输入 vsim test_sm_opt。
运行仿真
-
启用统计采样分析器:
- 选 Tools > Profile > Performance,或点击工具栏的 Performance Profiling 图标。
这一步必须在运行仿真之前完成。此后 Questa SIM 在仿真运行时就绪,可随时采集性能数据。
-
运行仿真:在 VSIM> 提示符输入:
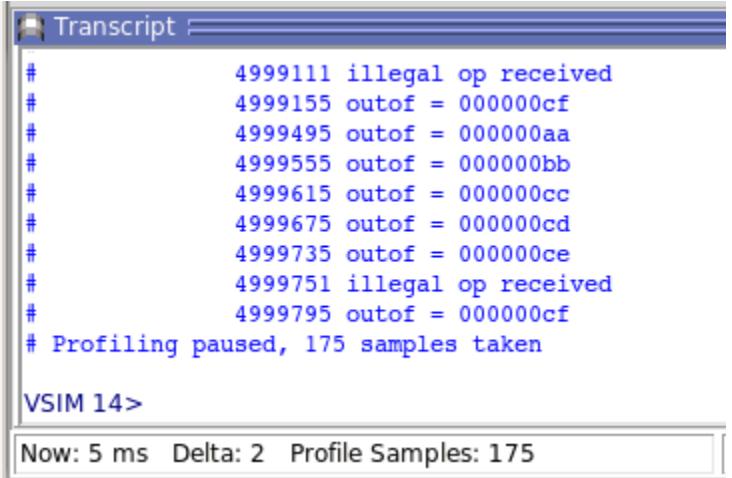
run 5 ms注意 Transcript 和主窗口状态栏都会显示采样次数(Figure 12-1,你的结果可能与图中不同)。Questa SIM 还会报告落在你的设计代码(而非仿真器内部代码)中的采样百分比。
在 Profile 窗口中查看性能数据
统计性能数据显示在四个 profile 窗口:Ranked、Call Tree、Structural 和 Design Unit;更细的细节显示在 Profile Details 窗口。这些都通过主 GUI 的 View > Profiling 菜单打开。
-
查看排名式性能数据:选 View > Profiling > Ranked Profile。
Ranked 窗口按函数或实例显示统计性能分析器和内存分配分析器的结果(Figure 12-2)。默认按 In% 列排序,该列显示每个函数或实例占总采样数的百分比(你的结果可能与图中不同)。
Ranked 窗口内容示例:
| Name | Under(raw) | In(raw) | Under(%) | In(%) | M |
|---|---|---|---|---|---|
| _IO_file_write@@GLIBC_2.2… | 21 | 21 | 12.3% | 12.3% | |
| truncate | 17 | 17 | 9.9% | 9.9% | |
| test_sm.v:105 | 59 | 11 | 34.5% | 6.4% | |
| test_sm.v:136 | 8 | 8 | 4.7% | 4.7% | |
| test_sm.v:92 | 7 | 7 | 4.1% | 4.1% | |
| vfprintf | 6 | 4 | 3.5% | 2.3% | |
| test_sm.v:138 | 4 | 4 | 2.3% | 2.3% | |
| beh_sram.v:22 | 3 | 3 | 1.8% | 1.8% | |
| _IO_old_init | 2 | 2 | 1.2% | 1.2% |
点击任意列标题即可按该列排序;点 Name 列左侧的下箭头可打开 Configure Columns 对话框,选择隐藏或显示哪些列。显示配色提供直观提示:默认红色文字表示消耗了 5% 以上仿真时间的函数或实例。注意 Ranked 标签页不提供层次化的函数调用信息。
- 以层次化函数调用树的形式查看性能数据:
- 选 View > Profiling > Call Tree Profile。
- 在 Calltree 窗口右键,弹出菜单选 Expand All,展开函数调用层次(Figure 12-3)。数据默认按 Under(%) 列排序。
展开后的层次函数调用树:
| Name | Under(raw) | In(raw) | Under(%) | In(%) | %Parent |
|---|---|---|---|---|---|
| test_sm.v:105 | 59 | 11 | 34.5% | 6.4% | 56% |
| IO_fflush | 18 | 0 | 10.5% | 0.0% | 31% |
| IO_file_sync@@GLIBC… | 18 | 0 | 10.5% | 0.0% | 100% |
| IO_do_write@@GLIB… | 18 | 0 | 10.5% | 0.0% | 100% |
| IO_file_write@@G… | 18 | 18 | 10.5% | 10.5… | 100% |
| truncate | 16 | 16 | 9.4% | 9.4% | 27% |
| IO_vsnprintf | 8 | 0 | 4.7% | 0.0% | 14% |
| yfprintf | 6 | 4 | 3.5% | 2.3% | 75% |
| IO_default_xsputn | 2 | 1 | 1.2% | 0.6% | 33% |
| IO_no_init | 2 | 0 | 1.2% | 0.0% | 25% |
| IO_old_init | 2 | 2 | 1.2% | 1.2% | 100% |
| libc_send | 2 | 2 | 1.2% | 1.2% | 3% |
| IO_ftell | 2 | 1 | 1.2% | 0.6% | 3% |
| test_sm.v:136 | 8 | 8 | 4.7% | 4.7% | 8% |
| test_sm.v:92 | 7 | 7 | 4.1% | 4.1% | 7% |
| test_sm.v:138 | 4 | 4 | 2.3% | 2.3% | 4% |
| sm.v:73 | 4 | 0 | 2.3% | 0.0% | 4% |
注意
你的结果可能略有差异,取决于所用计算机和仿真期间发生的不同系统调用;另外由于不同平台解码调用栈的方式不同,报告的行号可能与源文件实际行号偏差一两行。
- 以层次格式查看实例级性能数据:
- 选 View > Profiling > Structural Profile。
- 在 Structural profile 窗口右键,弹出菜单选 Expand All。Figure 12-4 显示与 Calltree 窗口相同的信息,但额外增加了一个按实例归类性能采样的维度。数据默认按 Under(%) 列排序。
Structural Profile 窗口内容示例:
| Name | Under(raw) | In(raw) | Under(%) | In(%) | %Parent |
|---|---|---|---|---|---|
| test_sm | 116 | 86 | 67.8% | 50.3% | … |
| sm_seq0 | 17 | 10 | 9.9% | 5.8% | 14.7% |
| sm_0 | 7 | 7 | 4.1% | 4.1% | 41.2% |
| sram_0 | 13 | 13 | 7.6% | 7.6% | 11.2% |
| <NoContext> | 55 | 55 | 32.2% | 32.2% | … |
-
按设计单元查看性能数据:选 View > Profiling > Design Unit Profile。
Design Units profile 窗口提供与 Structural profile 窗口类似的信息,但按设计单元组织,而非层次结构。数据默认按 Under(%) 列排序。
Design Unit 性能数据示例:
| Name | Count | Under(raw) | In(raw) | Under(%) | In(%) |
|---|---|---|---|---|---|
| sm_seq | 1 | 9 | 9 | 5.3% | 5.3% |
| test_sm.v:136 | 5 | 5 | 2.9% | 2.9% | |
| sm_seq.v:38 | 2 | 2 | 1.2% | 1.2% | |
| sm | 1 | 7 | 7 | 4.1% | 4.1% |
| sm.v:73 | 4 | 0 | 2.3% | 0.0% | |
| _IO_fflush | 3 | 0 | 1.8% | 0.0% | |
| _IO_file_sync@@GLIBC_2.2.5 | 3 | 0 | 1.8% | 0.0% | |
| sm.v:53 | 2 | 2 | 1.2% | 1.2% | |
| beh_sram | 1 | 8 | 8 | 4.7% | 4.7% |
| beh_sram.v:22 | 3 | 3 | 1.8% | 1.8% | |
| beh_sram.v:39 | 2 | 2 | 1.2% | 1.2% | |
| test_sm.v:138 | 2 | 2 | 1.2% | 1.2% | |
| test_sm | 1 | 81 | 81 | 47.4% | 47.4% |
| test_sm.v:105 | 59 | 11 | 34.5% | 6.4% | |
| _IO_fflush | 18 | 0 | 10.5% | 0.0% | |
| _IO_file_sync@@GLIBC_2.2.5 | 18 | 0 | 10.5% | 0.0% | |
| truncate | 16 | 16 | 9.4% | 9.4% | |
| _IO_vsnprintf | 8 | 0 | 4.7% | 0.0% |
-
点击 Profile 窗口跳转到源代码:
性能 profile 窗口与 Source 窗口动态联动。双击某个实例、函数、设计单元或行号,即可在 Source 窗口中直接跳到相关源代码;也可以在任意 profile 窗口右键任意函数、实例、设计单元或行号,弹出菜单选 View Source。
- Verilog:在 Design Units profile 窗口双击 test_sm.v:105,Source 窗口打开并显示第 105 行(Figure 12-6)。
- VHDL:双击 test_sm.vhd:201,Source 窗口打开并显示第 201 行。
//home/billb/tutorials/verilog/profiler/test_sm.v (/test_sm) - Default
Ln#
105    always @ (outof)  // any change of outof
106    $display ($time, "outof = %h", outof);
107
108
109
110
111
112
113
114
115
/* tests */
initial
begin
rst = 0;
查看 Profile 细节
Profile Details 窗口提供对仿真性能的进一步洞察。在 Ranked 或 Call Tree 窗口右键任意函数,弹出菜单包含 Function Usage 选项;选中后 Profile Details 窗口打开,显示所有使用该函数的实例。
-
在 Call Tree 窗口查看某函数的 Profile Details:
- 在 Call Tree 窗口右键 test_sm.v:136 函数,弹出菜单选 Function Usage。
Profile Details 窗口显示所有使用函数 Tcl_WaitForEvent 的实例(Figure 12-7),统计性能数据展示该函数在每个实例中占用的仿真时间。
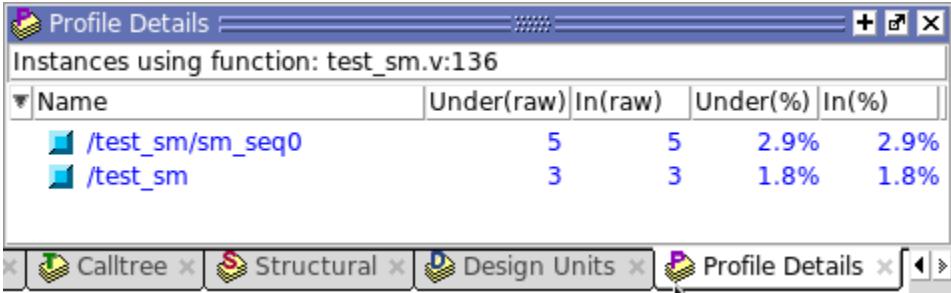
在 Structural 窗口右键选中的函数或实例时,弹出菜单会根据所选对象显示 Function Usage 或 Instance Usage 选项。
- 在 Structural 窗口查看某实例的 Profile Details:
- 点击 Structural 标签切换到 Structural profile 窗口。
- 右键 test_sm,弹出菜单选 Expand All。
- Verilog:右键 sm_0 实例,弹出菜单选 Instance Usage。Profile Details 显示所有与 /test_sm/sm_seq0/sm_0 定义相同的实例(Figure 12-8)。
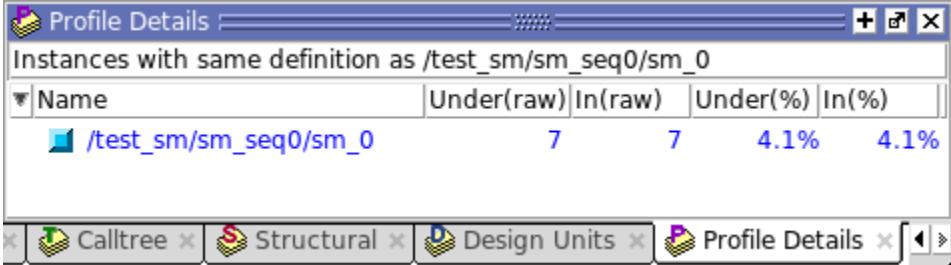
- VHDL:右键 dut 实例,弹出菜单选 Instance Usage,显示所有与 /test_sm/dut 定义相同的实例。
过滤数据
最后,用 Profiler 工具栏滤掉耗时不足 3% 的行:
- 点击 Calltree 标签切回 Calltree 窗口。
- 把 Under(%) 字段改为 3(Figure 12-9)。
Profile 工具栏:
| Under % | 3 |
|---|
如果看不到这些工具栏按钮,在工具栏空白处右键,从可用工具栏弹出菜单中选 Profile。
-
点击 Refresh Profile Data 按钮。
Questa SIM 过滤列表,只显示占仿真时间 3% 以上的行(Figure 12-10):
| Name | Under(raw) | In(raw) | Under(%) | In(%) |
|---|---|---|---|---|
| test_sm.v:105 | 59 | 11 | 34.5% | 6.4% |
| _IO_fflush | 18 | 0 | 10.5% | 0.0% |
| _IO_file_sync@@GLIBC… | 18 | 0 | 10.5% | 0.0% |
| _IO_do_write@@GLIB… | 18 | 0 | 10.5% | 0.0% |
| _IO_file_write@@G… | 18 | 18 | 10.5% | 10.5% |
| truncate | 16 | 16 | 9.4% | 9.4% |
| _IO_vsnprintf | 8 | 0 | 4.7% | 0.0% |
| vfprintf | 6 | 4 | 3.5% | 2.3% |
| test_sm.v:136 | 8 | 8 | 4.7% | 4.7% |
| test_sm.v:92 | 7 | 7 | 4.1% | 4.1% |
生成性能分析报告
Questa SIM 可以基于 profiler 数据生成多种报告。生成一份调用树型性能报告:
- 在 Calltree 窗口打开的情况下,选菜单 Tools > Profile > Profile Report,打开 Profile Report 对话框。
- 在对话框中(Figure 12-11)选 Call Tree Type。
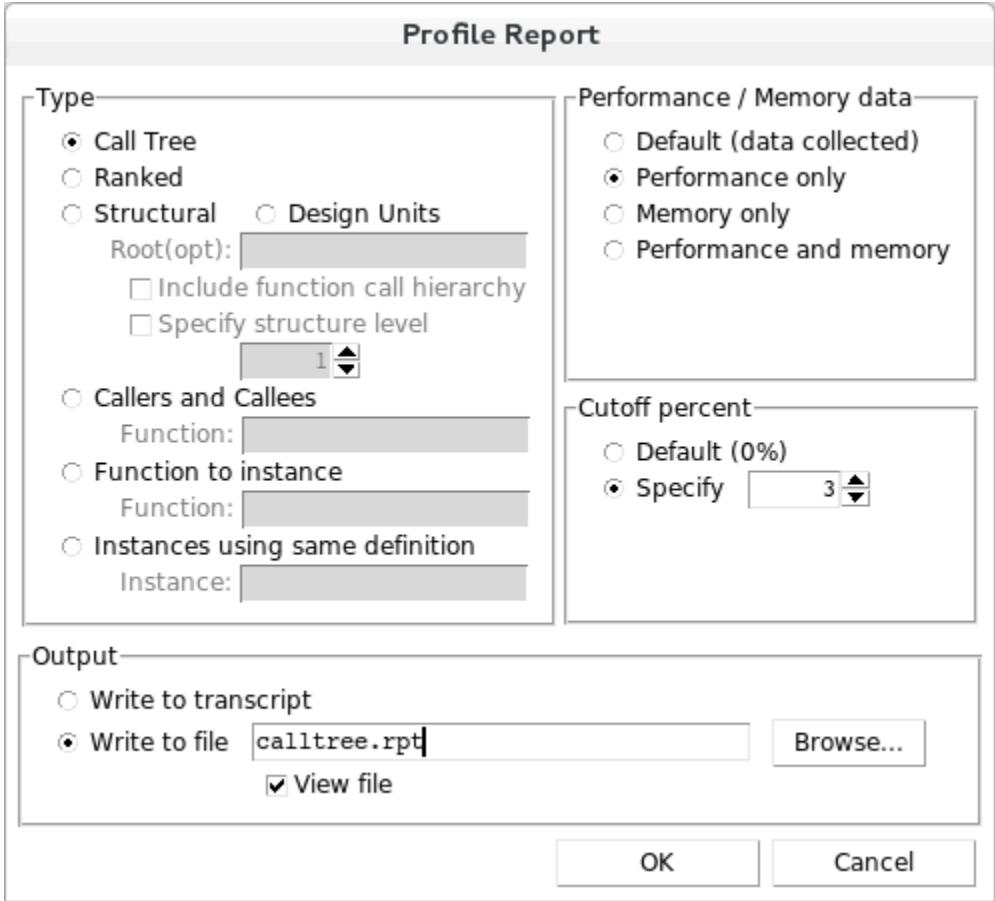
- Performance/Memory data 区选 Performance only。
- Cutoff percent 指定为 3%。
- 勾选 Write to file,文件名栏输入 calltree.rpt。
- 选中 Write to file 后 View file 默认勾选,保持不动。
- 点 OK。
calltree.rpt 报告文件会自动在 Notepad 中打开(Figure 12-12):
Notepad
File Edit Window
calltree.rpt
Questa Sim-64 vsim QA Baseline Assertion: 10.5 Beta - 2918657 Simulator 2015.12 Dec
Platform: linux_x86_64
Signature: 7e23fff1lbe3d65277816a2abf906d73
Calltree profile generated Fri Dec 11 18:58:17 2015
Number of samples: 171
Number of samples in user code: 105 (61%)
Cutoff percentage: 3%
Keep unknown: 1
Collapse sections: 0
Collect callstacks: 0
Memory trim height: 0
Keep free: 1
Profile data: vsimk (ModelSim kernel)
Name Under(raw) In(raw) Under(%) In(%) %Parent
test_sm.v:105 59 11 34.5 6.4 56
_IO_fflush 18 0 10.5 0.0 31
_IO_file_sync@@GLIBC_2.2.5 18 0 10.5 0.0 100
_IO_do_write@@GLIBC_2.2.5 18 0 10.5 0.0 100
_IO_file_write@@GLIBC_2.2.5 18 18 10.5 10.5 100
truncate 16 16 9.4 9.4 27
_IO_vsnprintf 8 0 4.7 0.0 14
vfprintf 6 4 3.5 2.3 75
test_sm.v:136 8 8 4.7 4.7 8
test_sm.v:92 7 7 4.1 4.1 7
也可以用命令行的 profile report 命令输出此报告,详见 Questa SIM Command Reference。
本课收尾
本章到此结束。继续之前需要结束当前仿真:选 Simulate > End Simulation,然后点 Yes。
自测
自测
- Questa SIM 把哪些类型视为「memory」?Verilog 与 VHDL 示例设计在未运行仿真时,内存数据显示有何不同?
- 导出可重定位(relocatable)内存模式文件的关键设置是什么?它和普通内存文件的区别在哪里?
- 用 reloc.mem + Increment 填充模式初始化 spram3 时,地址 251 之后的数据是怎么来的?
- Profiler 必须在什么时机启用?Ranked、Call Tree、Structural、Design Unit 四个窗口各自的侧重有何不同?
- 本例中 test_sm.v:105 占了 34.5% 的采样时间,你会如何借助 Profile 窗口与 Source 窗口的联动定位并优化这类热点?